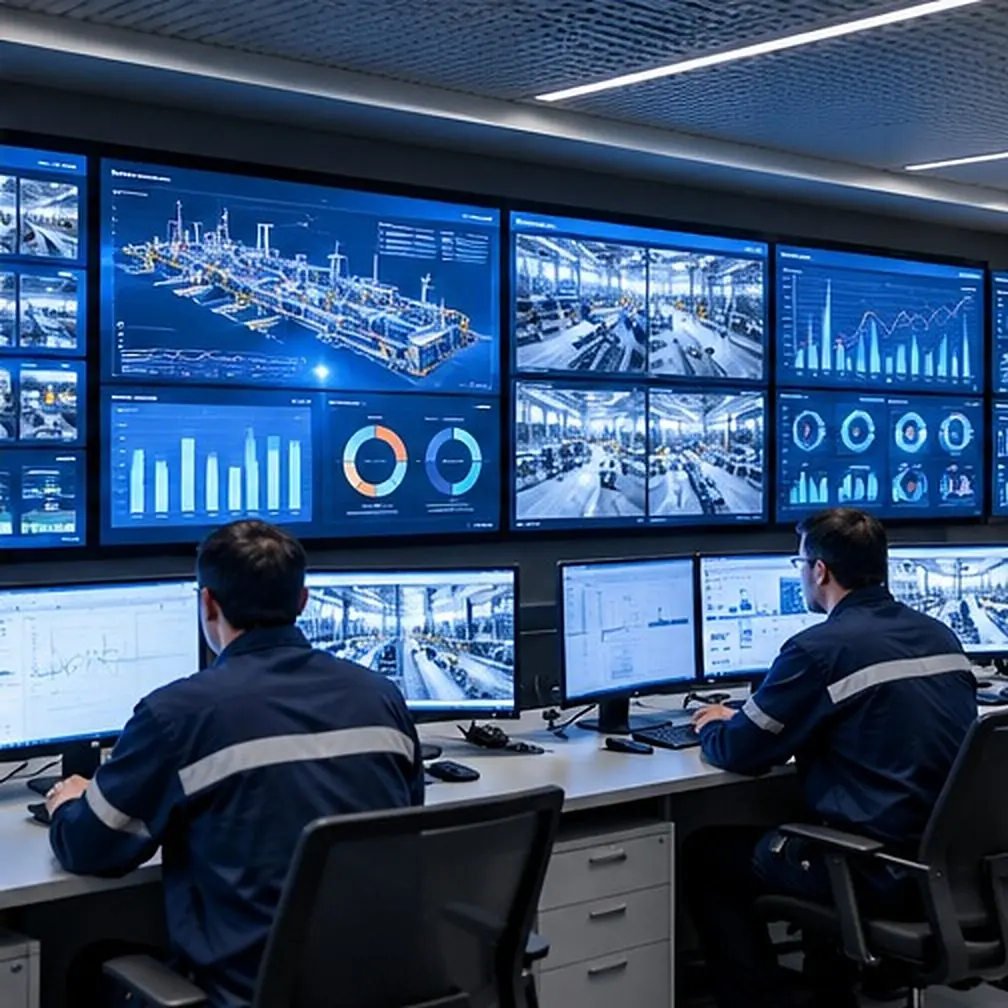
Equipment and operational performance
A practical first step for plants that need visibility before full MES. See how long each machine really ran, why it stopped and where production time went.
You can’t improve what you can’t see.
Vector11 Performance makes equipment losses visible so manufacturing teams can act.
- How long did each machine actually run?
- Why did it stop, and for how long?
- Which machine or line performs best?
- What are our biggest recurring stoppages?
What the shop floor sees
An example of the views Performance provides. All figures are demonstration data.
Shift A, 06:00–14:00
Demonstration dataMachine states
OEE, Line 1 mill
Top downtime causes, minutes
How it works
Deployable in days or weeks where connectivity and site readiness allow, rather than through a long MES rollout.
Connect signals
Use existing PLC data, or add simple sensors and I/O.
Collect at the edge
Machine states and counts captured reliably.
Classify stoppages
Downtime reasons agreed with operators.
Act on the data
Shift, machine and loss views for daily routines.
Features
- Run, idle, stop and fault states
- Availability and downtime analysis
- Production rates and utilisation
- OEE where quality and rate inputs exist
- Downtime classification by cause
- Condition visibility from vibration or temperature signals
- Shift and machine comparisons
- Event notifications and energy visibility
Performance is monitoring and operational analytics. Predictive maintenance and predictive quality are part of our offering through our strategic partner Algo8 and its PlantBrain platform.
What improvement can you expect?
Typical areas of improvement. Quantified results are published only when verified with the client.
Lost time made visible
Run, idle and stop time measured per machine and shift.
Better utilisation
Recurring losses ranked by cause, so effort goes where it matters.
Focused teams
Maintenance and production working from the same facts.
Faster decisions
Shift performance available during the shift, not after it.
Explore more solutions
Vector11 Automation & Connectivity
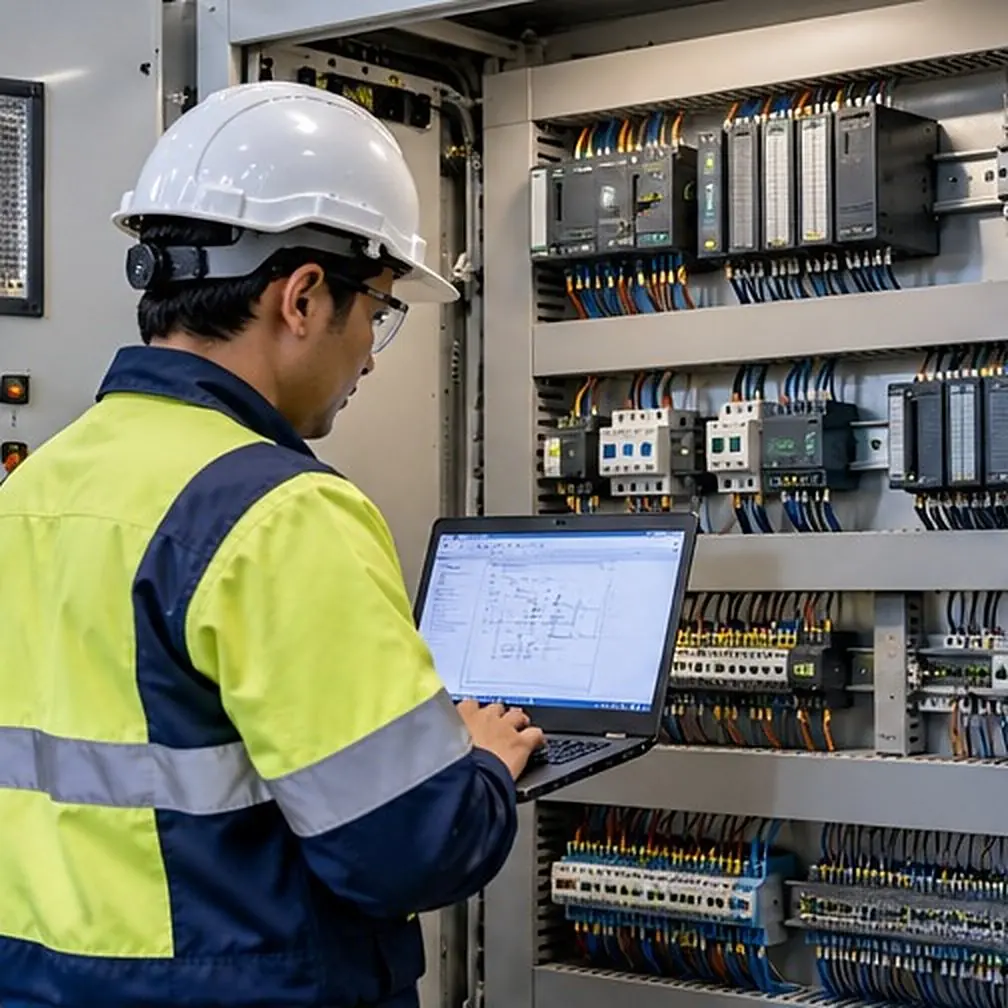
Modernise controls and connect machines of every age and make.
Explore Automation & Connectivity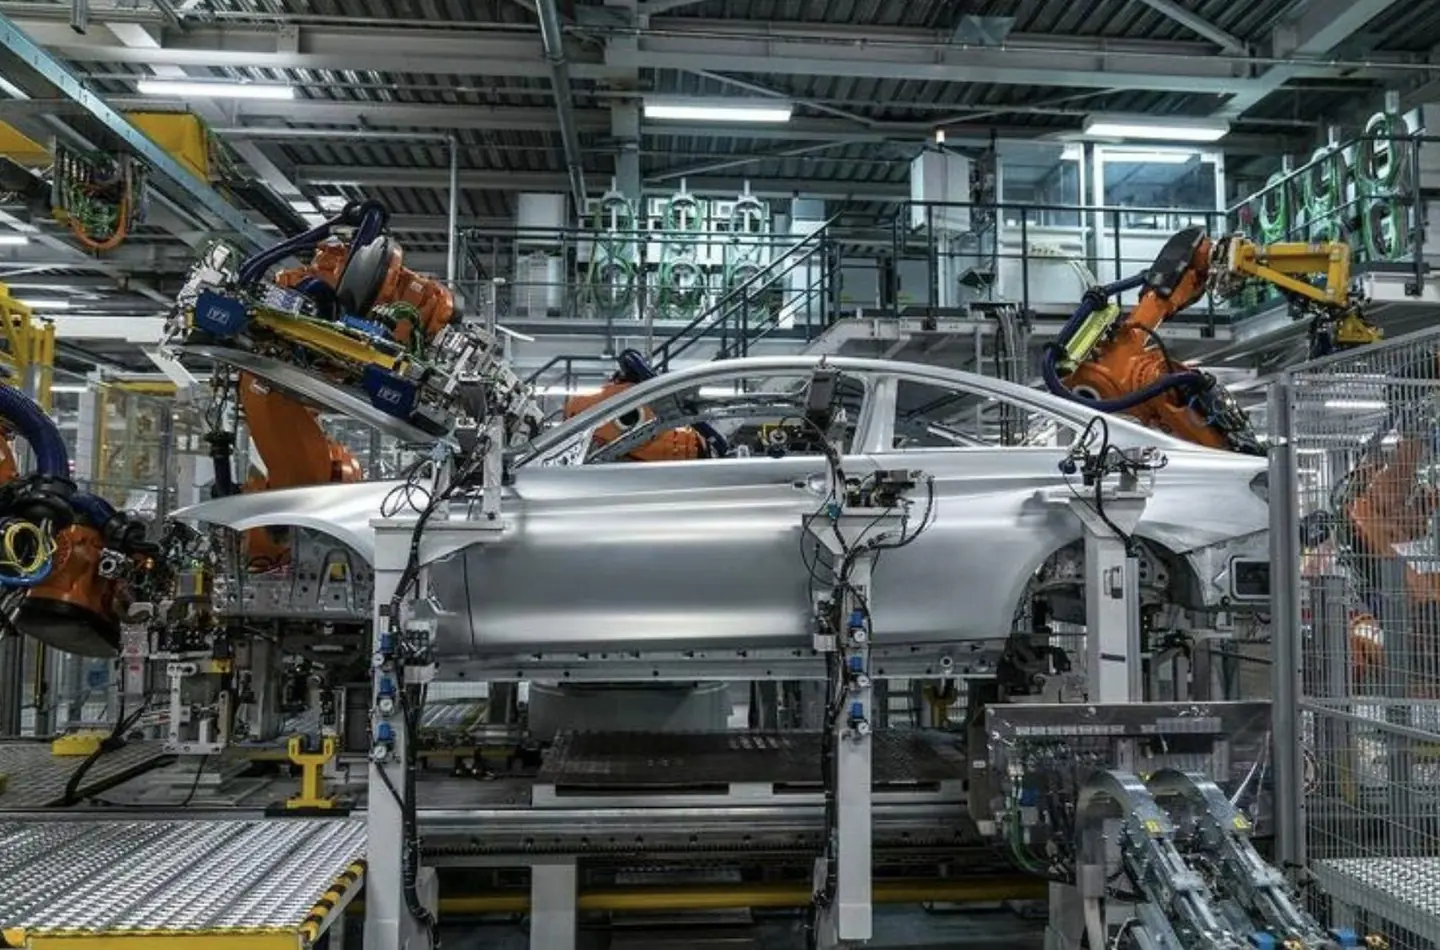
Vector11 SMART MES
Govern production, material flow, quality and traceability.
Explore SMART MES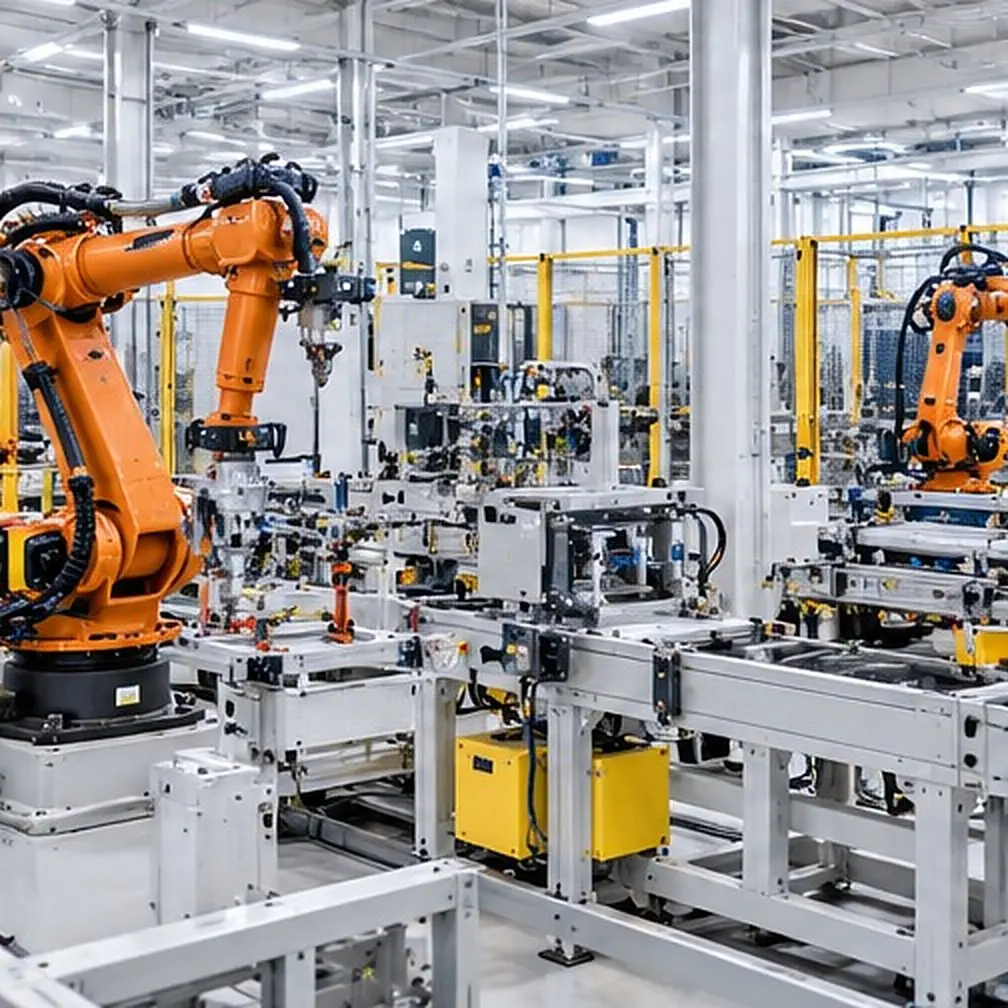
Vector11 Enterprise Intelligence
Connect manufacturing performance with business information and decisions.
Explore Enterprise IntelligenceFind out where your production time goes.
Whether the priority is equipment performance, controls modernisation, MES, traceability or ERP integration, tell us what is holding your plant back and we will suggest a practical way forward.